Last updated
Turlock woke up Wednesday with Amy Bublak leading the mayoral race by 651 votes and a City Council contest separated by just 31 votes. The overnight returns favor three City Hall incumbents, but the local races remain unofficial as more ballots are processed.
The figures below use the Stanislaus County report issued November 4 at 1:05 a.m. for local contests and the California Secretary of State’s 6:27 a.m. statewide and districtwide returns for the larger races. A news organization’s race call is identified separately from an official certification.
- The Mayoral Race
- City Council Districts 1 and 3
- Turlock and Denair School Boards
- Congress and the Legislature
- Governor and Other Statewide Offices
- All 14 State Propositions
- What Happens to the Remaining Ballots
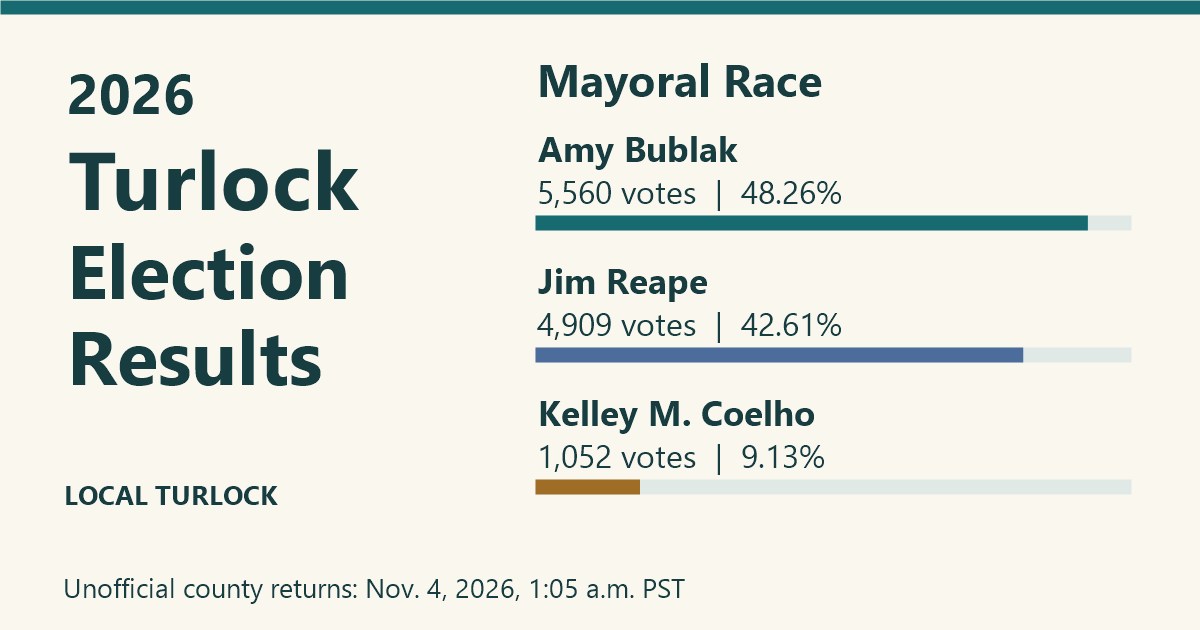
Amy Bublak Leads Jim Reape in the Mayoral Count
| Candidate | Votes | Share |
|---|---|---|
| Amy Bublak | 5,560 | 48.26% |
| Jim Reape | 4,909 | 42.61% |
| Kelley M. Coelho | 1,052 | 9.13% |
The county has recorded 11,521 votes for the three listed mayoral candidates. Amy leads Jim by 651 votes, or 5.65 percentage points. Kelley is third. These are the numbers in the overnight report, rather than a declaration that the contest has been decided.
The two methods of voting tell slightly different parts of the story. Among counted vote-by-mail ballots, Amy has 4,748 votes to Jim’s 4,297, a 451-vote advantage. At vote centers, Amy has 812 to Jim’s 612, adding another 200 votes to her lead. Kelley has 814 mail votes and 238 vote-center votes.
Those categories describe ballots already included in this report. They do not tell us how the uncounted ballots will break, and they do not establish why a particular neighborhood or group supported a candidate.
For Amy Bublak, the campaign is a bid for a third term. She became Turlock’s first woman mayor in 2018 after serving on the council. Her campaign emphasized public safety, city finances, street reconstruction and continuing projects begun during her tenure.
Jim Reape, a Planning Commission member since 2017 and longtime local healthcare professional, argued for steadier staffing, collaboration at City Hall and long-term road maintenance. Kelley Coelho, an investigator and Army veteran, emphasized accountability, responsiveness and school safety. Those were campaign priorities, rather than explanations the vote totals themselves can prove.
The Turlock Journal’s election-night report pictured Amy meeting supporters at Jura’s Pizza while holding an earlier lead. The county’s later report is the source for this article’s vote totals. For the candidates’ positions before Election Day, see our local representatives directory and the individual profiles linked above.
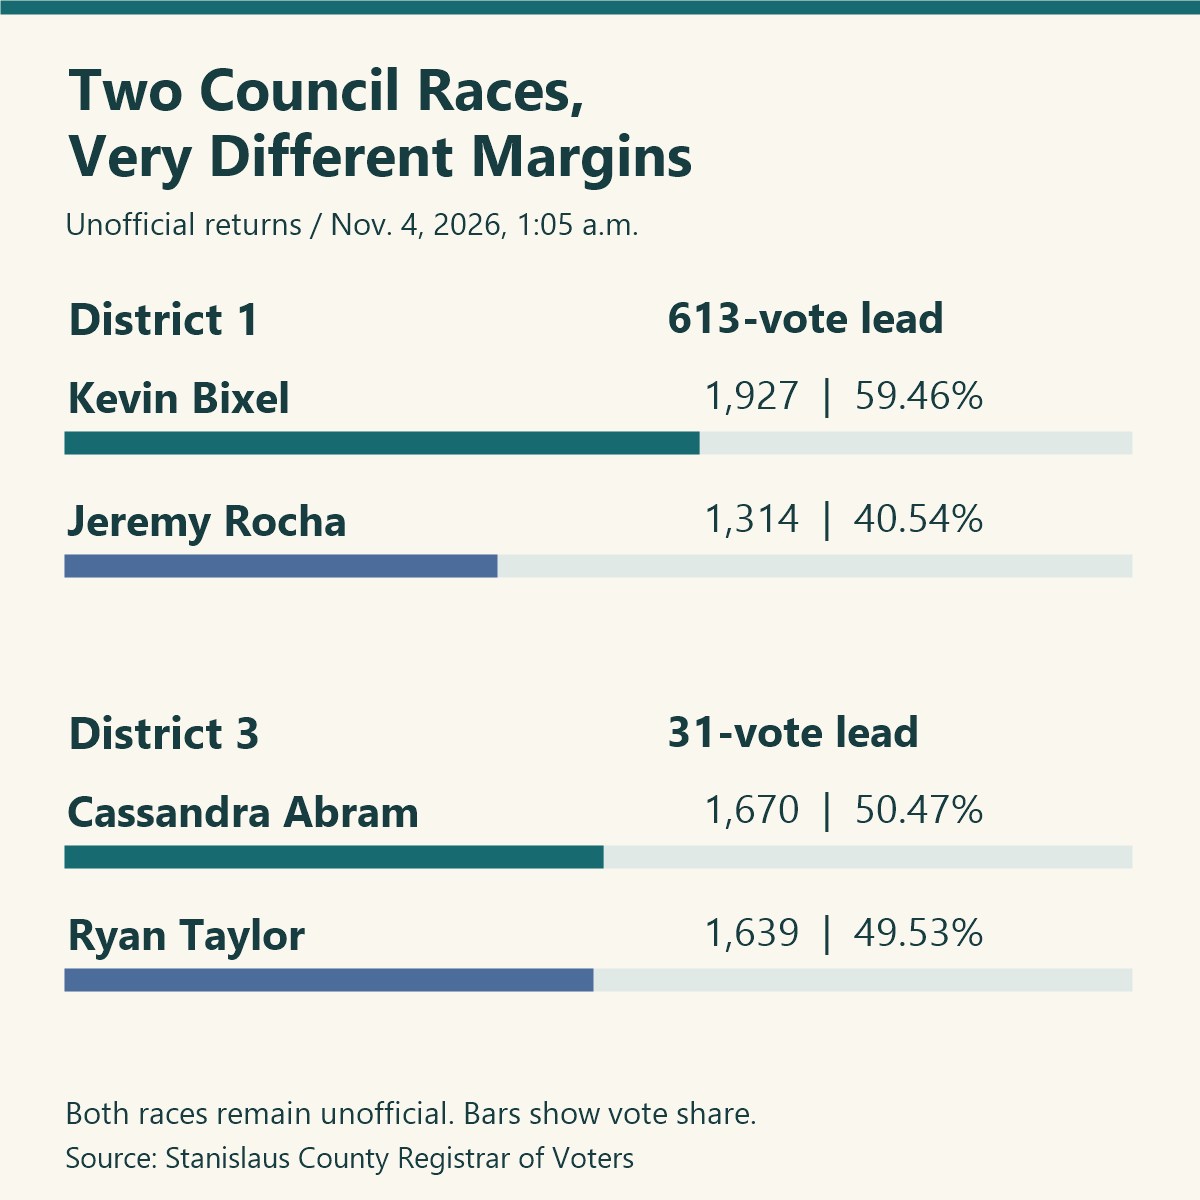
Cassandra Abram and Ryan Taylor Are Just 31 Votes Apart
District 3 is the closest of Turlock’s three contested City Hall races in this report. Incumbent Cassandra Abram has 1,670 votes, or 50.47%, against Ryan Taylor’s 1,639, or 49.53%. The difference is less than one percentage point.
Here, the voting-method breakdown makes the narrow margin especially clear. Cassandra leads the counted mail ballots 1,490 to 1,390. Ryan leads vote-center ballots 249 to 180. Subtracting Ryan’s 69-vote vote-center advantage from Cassandra’s 100-vote mail advantage leaves 31 votes.
In District 1, incumbent Kevin Bixel leads Jeremy Rocha 1,927 to 1,314. Kevin has 59.46% of the counted candidate vote, compared with Jeremy’s 40.54%, a 613-vote margin. The two district races should not be treated as equally close simply because both incumbents are ahead.
If the current leaders ultimately prevail, voters will have retained Amy, Kevin and Cassandra in the offices on this year’s ballot. That is a conditional description of the present count. Turlock’s council still makes decisions collectively; an individual mayor or councilmember cannot approve a city budget or contract alone.
Mary Jackson Leads for Turlock Unified Area 4
In Turlock Unified School District Area 4, Mary Jackson has 1,914 votes, or 71.82%, against Jayden Betbabanta’s 751 votes, or 28.18%. The recorded margin is 1,163 votes. School-board boundaries are separate from City Council districts, so an Area 4 school result is not a District 4 council result.
Denair Unified voters were choosing up to two board members. Mike Baker has 769 votes and Kathi Dunham-Filson has 595, followed by Gaby Cortes with 483 and Billy Ray Myers with 434. Mike and Kathi occupy the two leading positions in this report. Because voters could select two candidates, those totals should not be read as if everyone cast one vote in a two-person race.
Congress and the Legislature: Use the Entire District
The county report includes only the Stanislaus County portion of congressional and state legislative contests. The full district can have a different margin, and sometimes a different leader. The Secretary of State combines the participating counties.
| Race | Full-District Count | Status |
|---|---|---|
| U.S. House District 5 | Tom McClintock: 102,646 (56.2%) Michael Masuda: 79,957 (43.8%) | AP race call for Tom McClintock |
| U.S. House District 13 | Adam Gray: 58,217 (61.3%) Kevin Lincoln: 36,724 (38.7%) | Adam leads in the official tally |
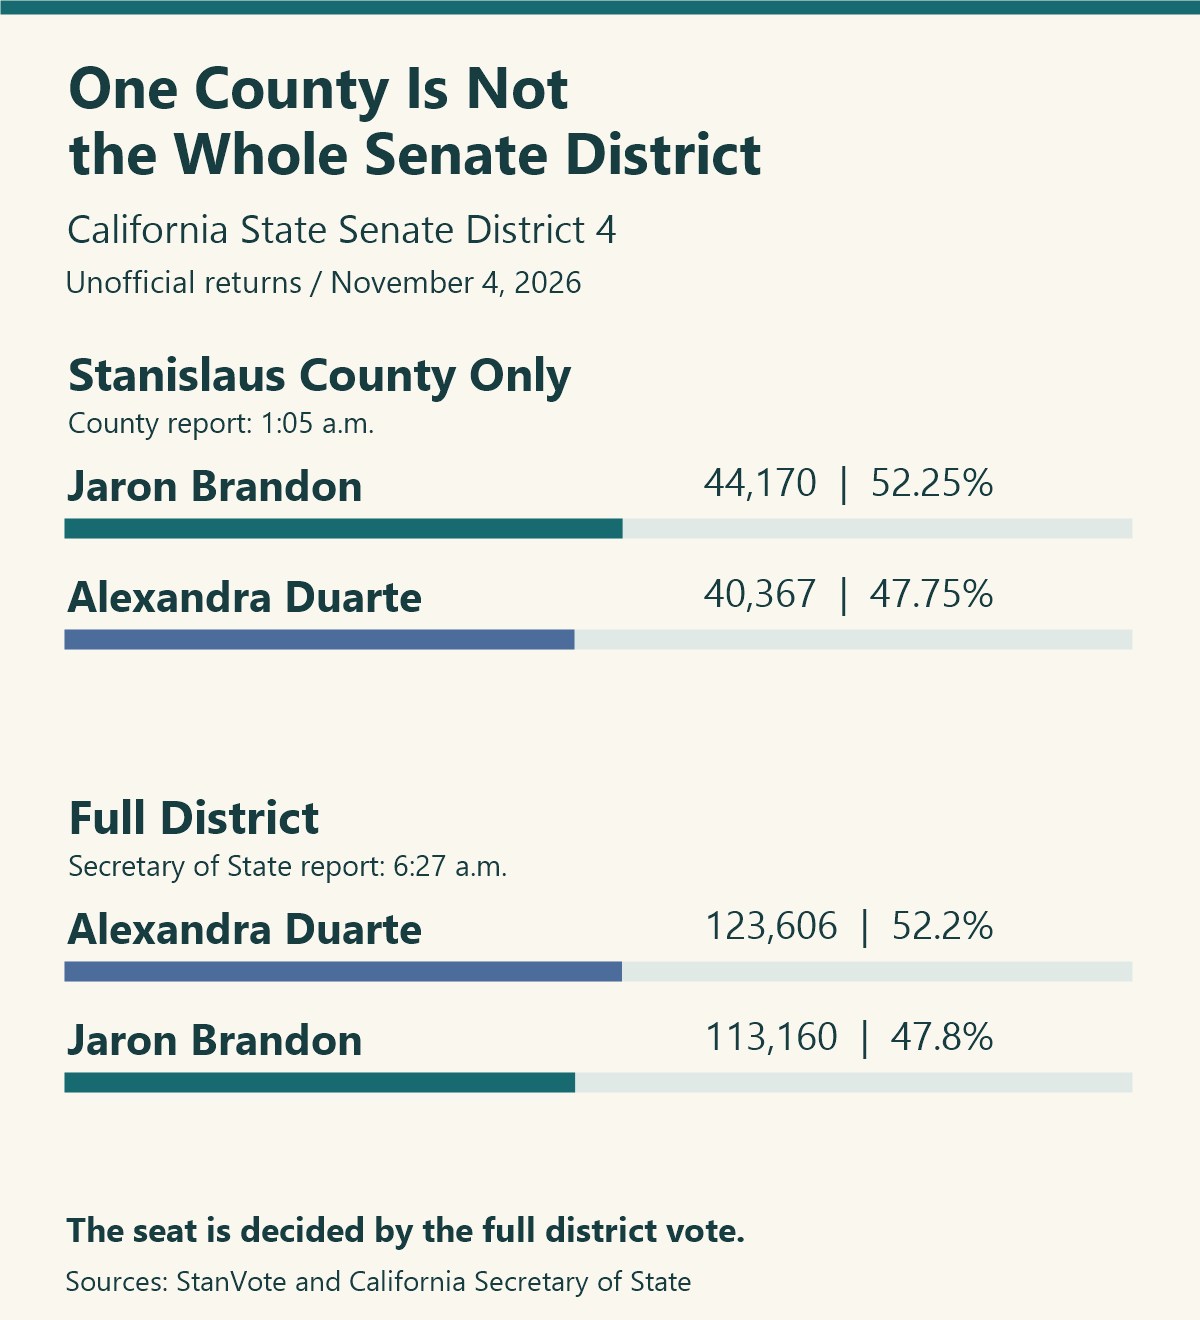
| State Senate District 4 | Alexandra Duarte: 123,606 (52.2%) Jaron Brandon: 113,160 (47.8%) | Alexandra leads districtwide |
| State Assembly District 22 | Juan Alanis: 45,013 (100%) | Juan was the only listed candidate |
Sources: official House District 5, House District 13, Senate District 4 and Assembly District 22 returns, all carrying the 6:27 a.m. report time. Fox News lists the AP call for Tom McClintock. A race call precedes certification.
Senate District 4 is the clearest example of the county-versus-district difference. Jaron leads in Stanislaus County with 44,170 votes, or 52.25%, to Alexandra’s 40,367, or 47.75%. Across the whole district, Alexandra leads by 10,446 votes. The county-only numbers would give readers the wrong impression of who is ahead for the seat.
For Juan, the 100% figure refers to the counted votes for the single candidate listed in that Assembly contest. It does not mean every registered voter voted for him.
Xavier Becerra Wins the Governor’s Race in the AP Call
KQED’s AP-powered results page identifies Xavier Becerra as the winner of the governor’s race against Steve Hilton. The official statewide tally at 6:27 a.m. has Xavier at 4,991,891 votes, or 63.9%, and Steve at 2,814,373, or 36.1%. The vote count continues after the news call.
Stanislaus County is considerably closer in that contest: Xavier has 52.92% here and Steve has 47.08%. The statewide electorate, rather than the county electorate, chooses the governor.
The same AP results page calls five other statewide offices. The percentages below come from the Secretary of State’s 6:27 a.m. returns; remaining contests are labeled as leads.
| Office | Statewide Returns | Status |
|---|---|---|
| Lieutenant Governor | Fiona Ma 63.8%; Gloria Romero 36.2% | AP called for Fiona |
| Secretary of State | Shirley N. Weber 64.7%; Donald P. (Don) Wagner 35.3% | AP called for Shirley |
| Controller | Malia M. Cohen 63.8%; Herb W. Morgan 36.2% | AP called for Malia |
| Treasurer | Eleni Kounalakis 64.0%; Jennifer Hawks 36.0% | AP called for Eleni |
| Attorney General | Rob Bonta 63.8%; Michael E. Gates 36.2% | AP called for Rob |
| Insurance Commissioner | Jane Kim 52.0%; Ben Allen 48.0% | Jane leads |
| Superintendent of Public Instruction | Richard Barrera 57.1%; Sonja Shaw 42.9% | Richard leads |
| Board of Equalization, District 1 | Nelson Esparza 53.9%; Shannon Grove 46.1% | Nelson leads districtwide |
Use the official statewide results menu for the continuing count in each office. The Board of Equalization result covers its full district, rather than all of California.
Where the State Propositions Stand
California’s propositions are also decided statewide. This table summarizes the Secretary of State’s 6:27 a.m. statewide returns. “Leading side” describes the current count; it is not a certified outcome.
| Prop. | Subject | Leading Side |
|---|---|---|
| 1 | Housing affordability bonds | Yes, 59.4% |
| 2 | Larger state rainy-day fund | Yes, 59.6% |
| 3 | Extending the high-income tax for schools and healthcare | Yes, 58.7% |
| 4 | Allowing public funding of election campaigns | No, 52.0% |
| 5 | Changing statewide recall elections | Yes, 50.3% |
| 37 | Loans for middle-income buyers of qualifying new homes | Yes, 61.0% |
| 38 | Immunology research bonds | Yes, 55.7% |
| 39 | Government-issued identification requirement for voting | No, 58.6% |
| 40 | One-time tax on certain taxpayers | No, 55.6% |
| 41 | Spending-limit and audit rules for new state taxes | No, 52.4% |
| 42 | Restrictions on new personal-property and certain retroactive taxes | Yes, 54.3% |
| 43 | Limits on raising revenue for local government services | No, 54.9% |
| 44 | Community health-clinic spending requirements | No, 81.8% |
| 45 | Environmental-review changes for certain projects | No, 54.1% |
Proposition 5 is especially close in the morning report: 3,706,564 yes votes to 3,657,452 no votes, a 49,112-vote difference. Its 50.3% yes share deserves a different description from a measure with a large margin. The official results page links the full legal title and voter-guide explanation for each proposal.
Why 100% of Precincts Does Not Mean Every Ballot
The county report lists all 206 precincts as reporting. It also labels the results unofficial. Those statements can both be true: precinct reporting is not a guarantee that every eligible mail, provisional or conditional-registration ballot has finished verification and counting.
The Secretary of State explains the ballots processed after Election Day, including mail ballots postmarked by Election Day and received within seven days, provisional ballots and ballots needing additional processing. Signature and registration checks take place before eligible ballots enter the count.
The county’s report shows 86,913 ballots against 301,333 registered voters, or 28.84%, countywide. For the citywide Turlock contest it shows 12,306 ballots against 40,481 registered voters, or 30.40%. Those are reported turnout figures at this stage, not final turnout and not the same thing as the number of votes cast for mayor.
For the next numbers, return to StanVote’s election-results page and check the report’s run date and time before comparing totals. Voters can also use California’s My Voter Status to check their own ballot status. The count still matters most in the close local races, especially the 31-vote District 3 contest.
What Should the Next Council Tackle First?
Road repairs, public safety, city services or another local priority? Tell us which project you want the next Turlock council to address.